From Laps to Legends: F1 Driver Battles Visualized with Metabase

"If you no longer go for a gap that exists, you're no longer a racing driver."
— Ayrton Senna
When F1 Stats Need a Pit Wall, Not a Spreadsheet
Endless debates ripple through paddocks, pubs, and online forums: who is truly the better driver, Lewis Hamilton or Michael Schumacher? Alain Prost or Ayrton Senna? Opinions are loud, but without data they remain just that; opinions. As lifelong F1 fans at Cloud Intelligence, we wanted a definitive, data-backed way to end the “who’s the best?, who’s the GOAT?” debate. To answer this puzzle, we engineered a Metabase dashboard that replaces opinion with data backed evidence. Formula 1’s history stretches from 1950 to 2025 and the raw results are sprawling, inconsistent, and difficult to slice cleanly. Manually comparing two careers across wins, podiums, reliability, and longevity is tedious and error-prone.
The Cloud Intelligence data team, using Metabase, set out to change that. We transformed decades of race records into an interactive, fan‑friendly dashboard that answers the head‑to‑head question in seconds. With a single stacked horizontal bar chart powered by smart SQL and well-structured Metabase models, dominance, and the nuances behind it simplified into an easy to digest view that help fans compare and answer their question on who is the better driver.
The Data Track: 1950–2024, Modeled to Race
Our data track begins with the well-known Kaggle Formula 1 dataset, covering from 1950-2024 seasons. Rather than dumping CSVs straight into charts, we modeled the data inside Metabase. Drivers, results, and constructors were unified through consistent joins, and core performance metrics: wins, podiums, DNFs, total races, total points were calculated and exposed through a tidy semantic layer. This approach eliminates brittle spreadsheet hacks and one-off extracts; instead, every visualization draws from the same trustworthy foundation.
The star of the dashboard is the Driver Head‑to‑Head comparison horizontal bar chart and cards. The central question sounds simple; between any two drivers, who actually dominated, and in what way?, but true dominance is multifaceted. Wins matter, but so do podiums for consistency, DNFs for reliability, and total races for longevity.
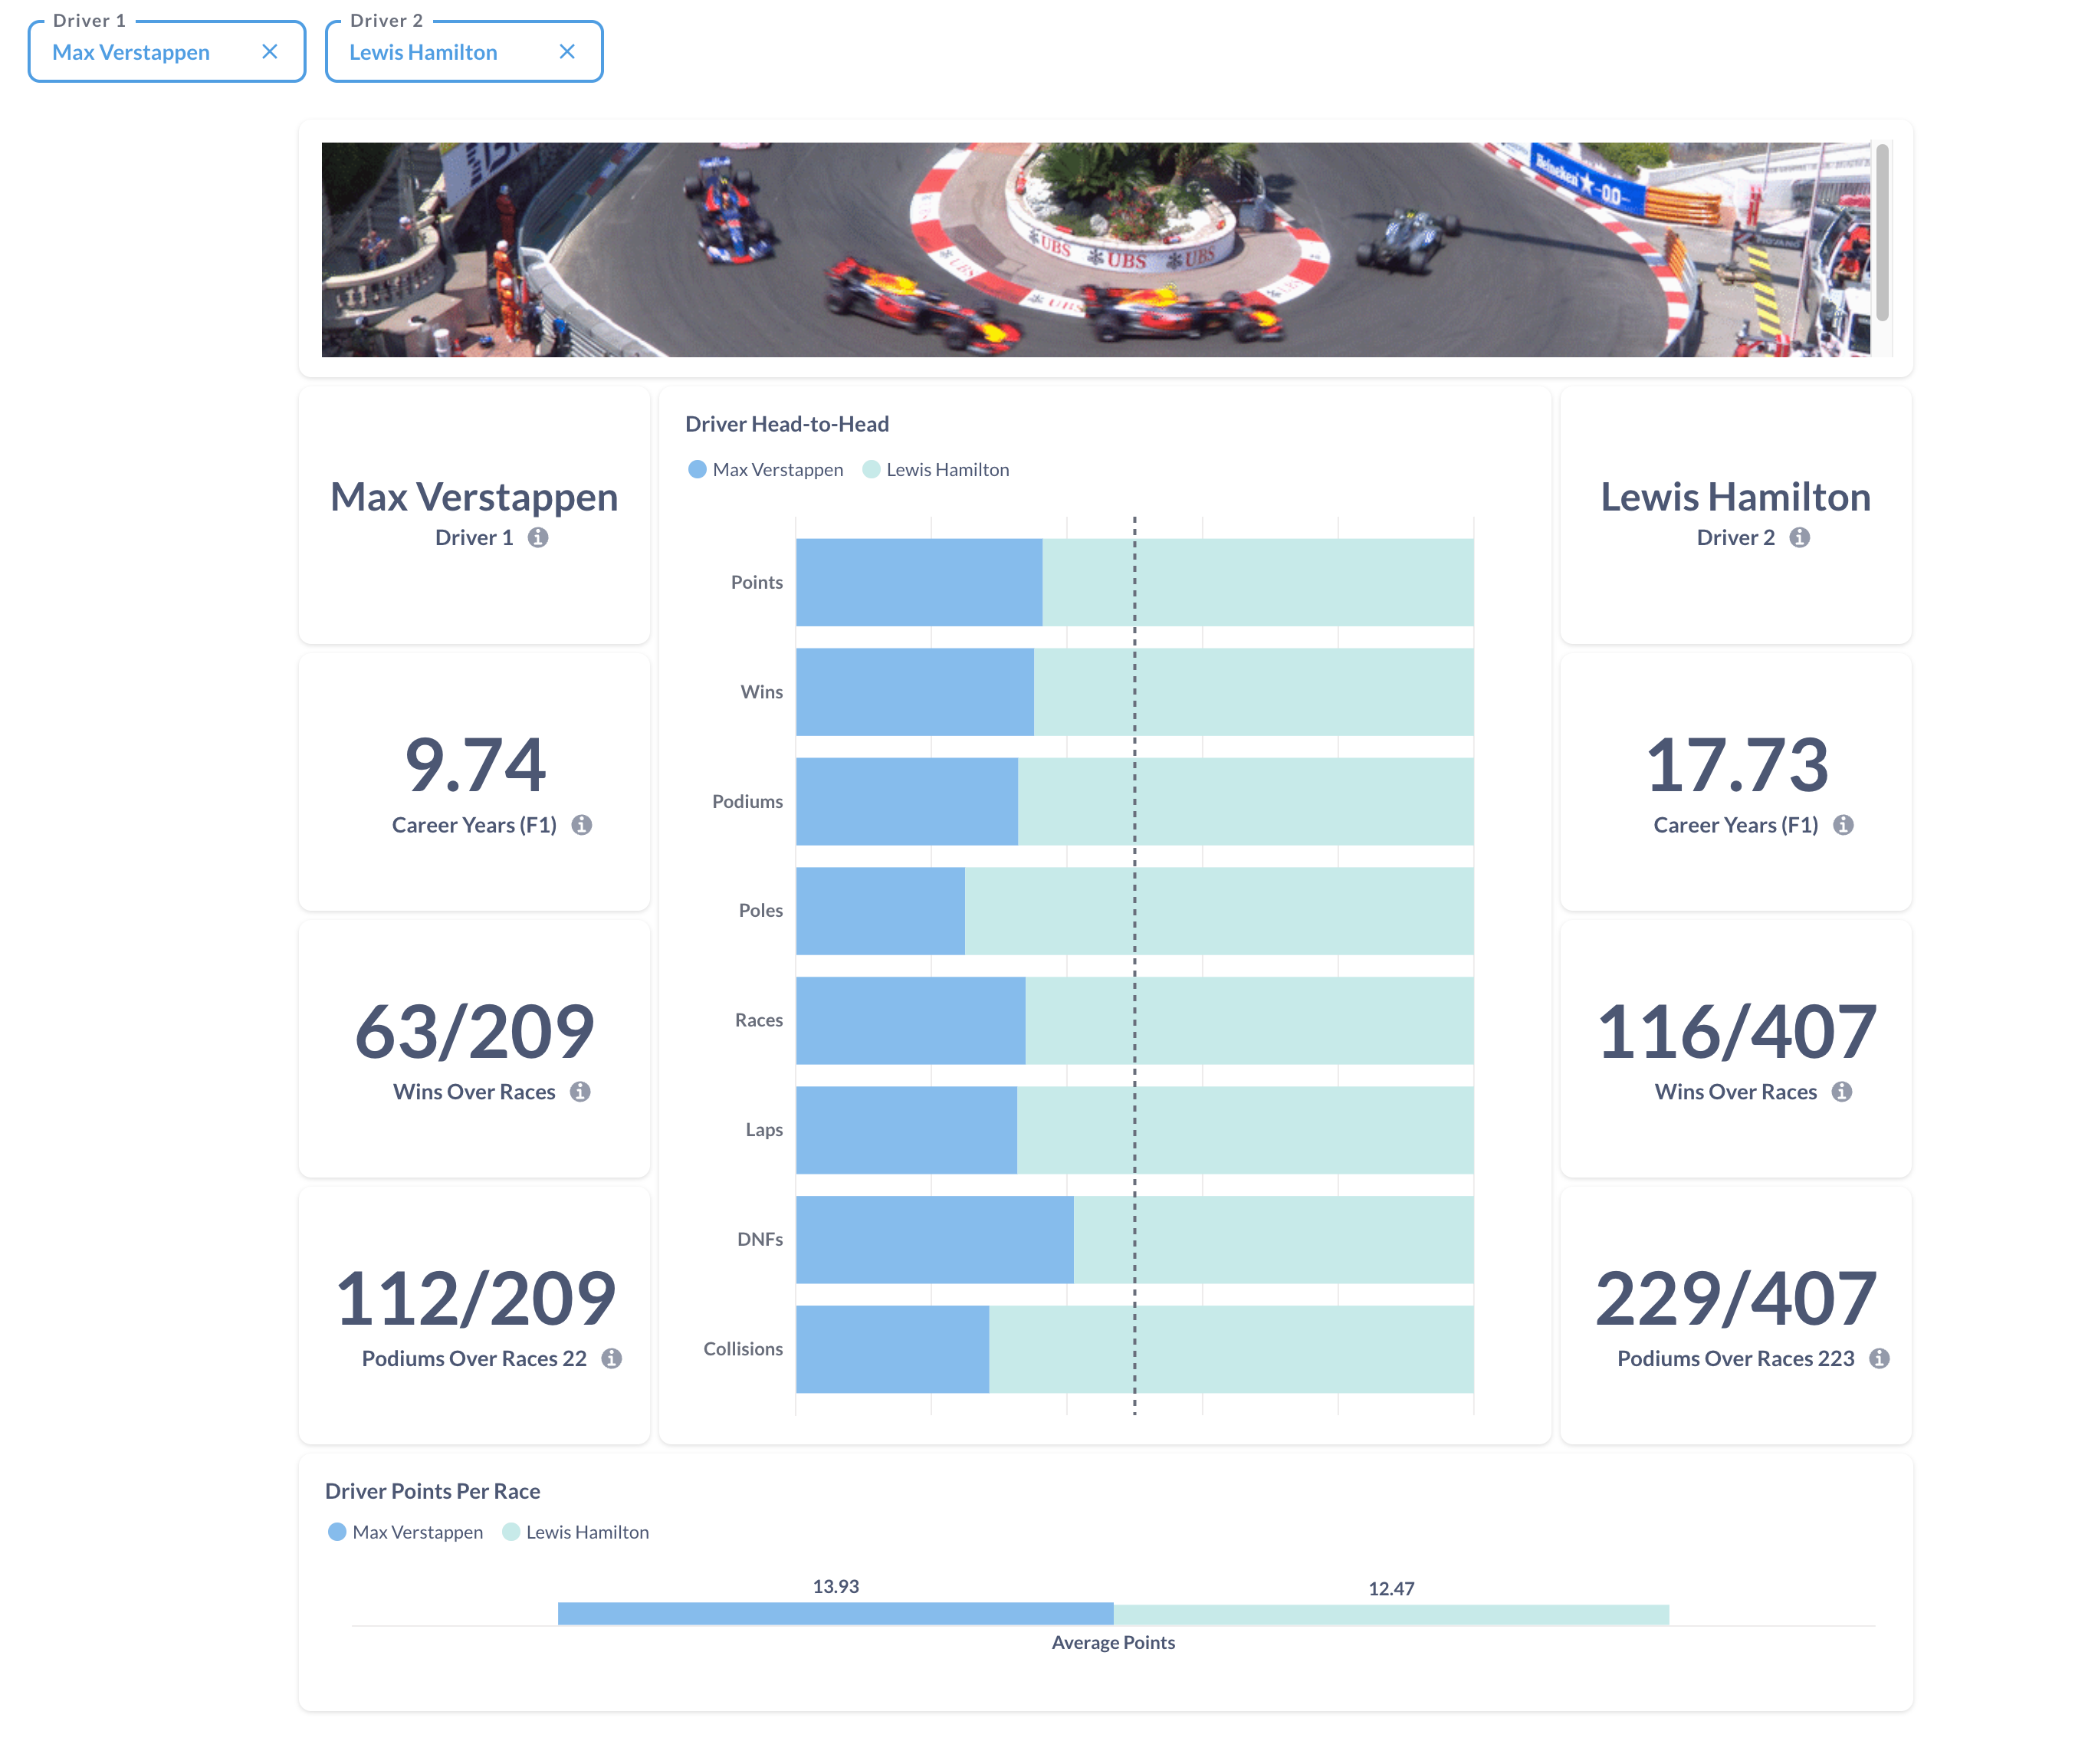
A stacked horizontal bar with cards and filters compare drivers across generations.
Our visualization presents each of these measures as a separate row in a stacked horizontal bar with the aid of cards. Every bar is split by driver, so the length instantly conveys who leads on a given metric while the color reveals how the totals divide. Imagine seeing that a driver with fewer wins still boasts a higher podium ratio across a five-year span, or that another’s points haul is impressive despite frequent DNFs. In a glance, fans have data-backed ammunition for the next debate; analysts gain context without hunting through multiple stat sites.
Why Metabase? The Open-Source Engine Behind the Dashboard
Metabase was the obvious choice for tearing down 75 years of F1 dataset and rebuilding them into something fans can actually interrogate. We needed to prototype fast, write real SQL, define clean models, and let users slice by driver or season without touching code. Metabase delivers all of that: a native SQL editor for complex CTEs, semantic models to standardize joins (drivers, results, constructors), polished visuals for the stacked H2H bars, and filter widgets that make comparisons instant. No enterprise licensing maze; just iterate, share, refine.
Paired with Cloud Intelligence’s disciplined data modeling, Metabase turns raw lap data into clarity: one trusted layer feeding every visualization, zero spreadsheet hacks. This dashboard proves how the right tool and the right team convert historic data into insight that matters.
What Cloud Intelligence Brings to the Paddock
We turn raw Formula 1 sport data into visuals that answer real questions, who is the better driver based on racing metrics. Whether those questions fuel fan debates or boardroom decisions. Our process starts with understanding the stakeholder’s needs, moves through clean data modeling, and culminates in rapid dashboard builds that we iterate until they hit the mark.
In the Cloud Intelligence data team , Metabase and SQL are our tools of choice, but domain fluency is the secret sauce. This F1 demo is one among many vertical showcases we’ve built in finance, logistics, and retail; the industries change, but the clarity-first mindset does not.
Ready to settle debates with real data? If we can end the “greatest driver” argument with data, imagine what we can do for your business. Book a Book a demo or collaborate with us. We’ll share starter models or build a custom analytics stack around your needs. Your move.
Made with ❤️ by Cloud Intelligence